Amazon controlling
that drives
action and profitAmazon controlling that drives
action and profit - not just reports
Stop guessing.
Start controlling.
IDENTIFY → ACT → MONITOR → REPEAT
No reports nobody reads. No spreadsheet chaos. Problems served on a plate!
01
Identify
Problems surface instantly in your controlling dashboard. Filter, group, sort by any KPI - ABC analysis included, no setup needed.
02
Act
Dedicated dashboards per use case. Every metric one click away - drill-downs, adjustments, actions, zero spreadsheet detours.
03
Track
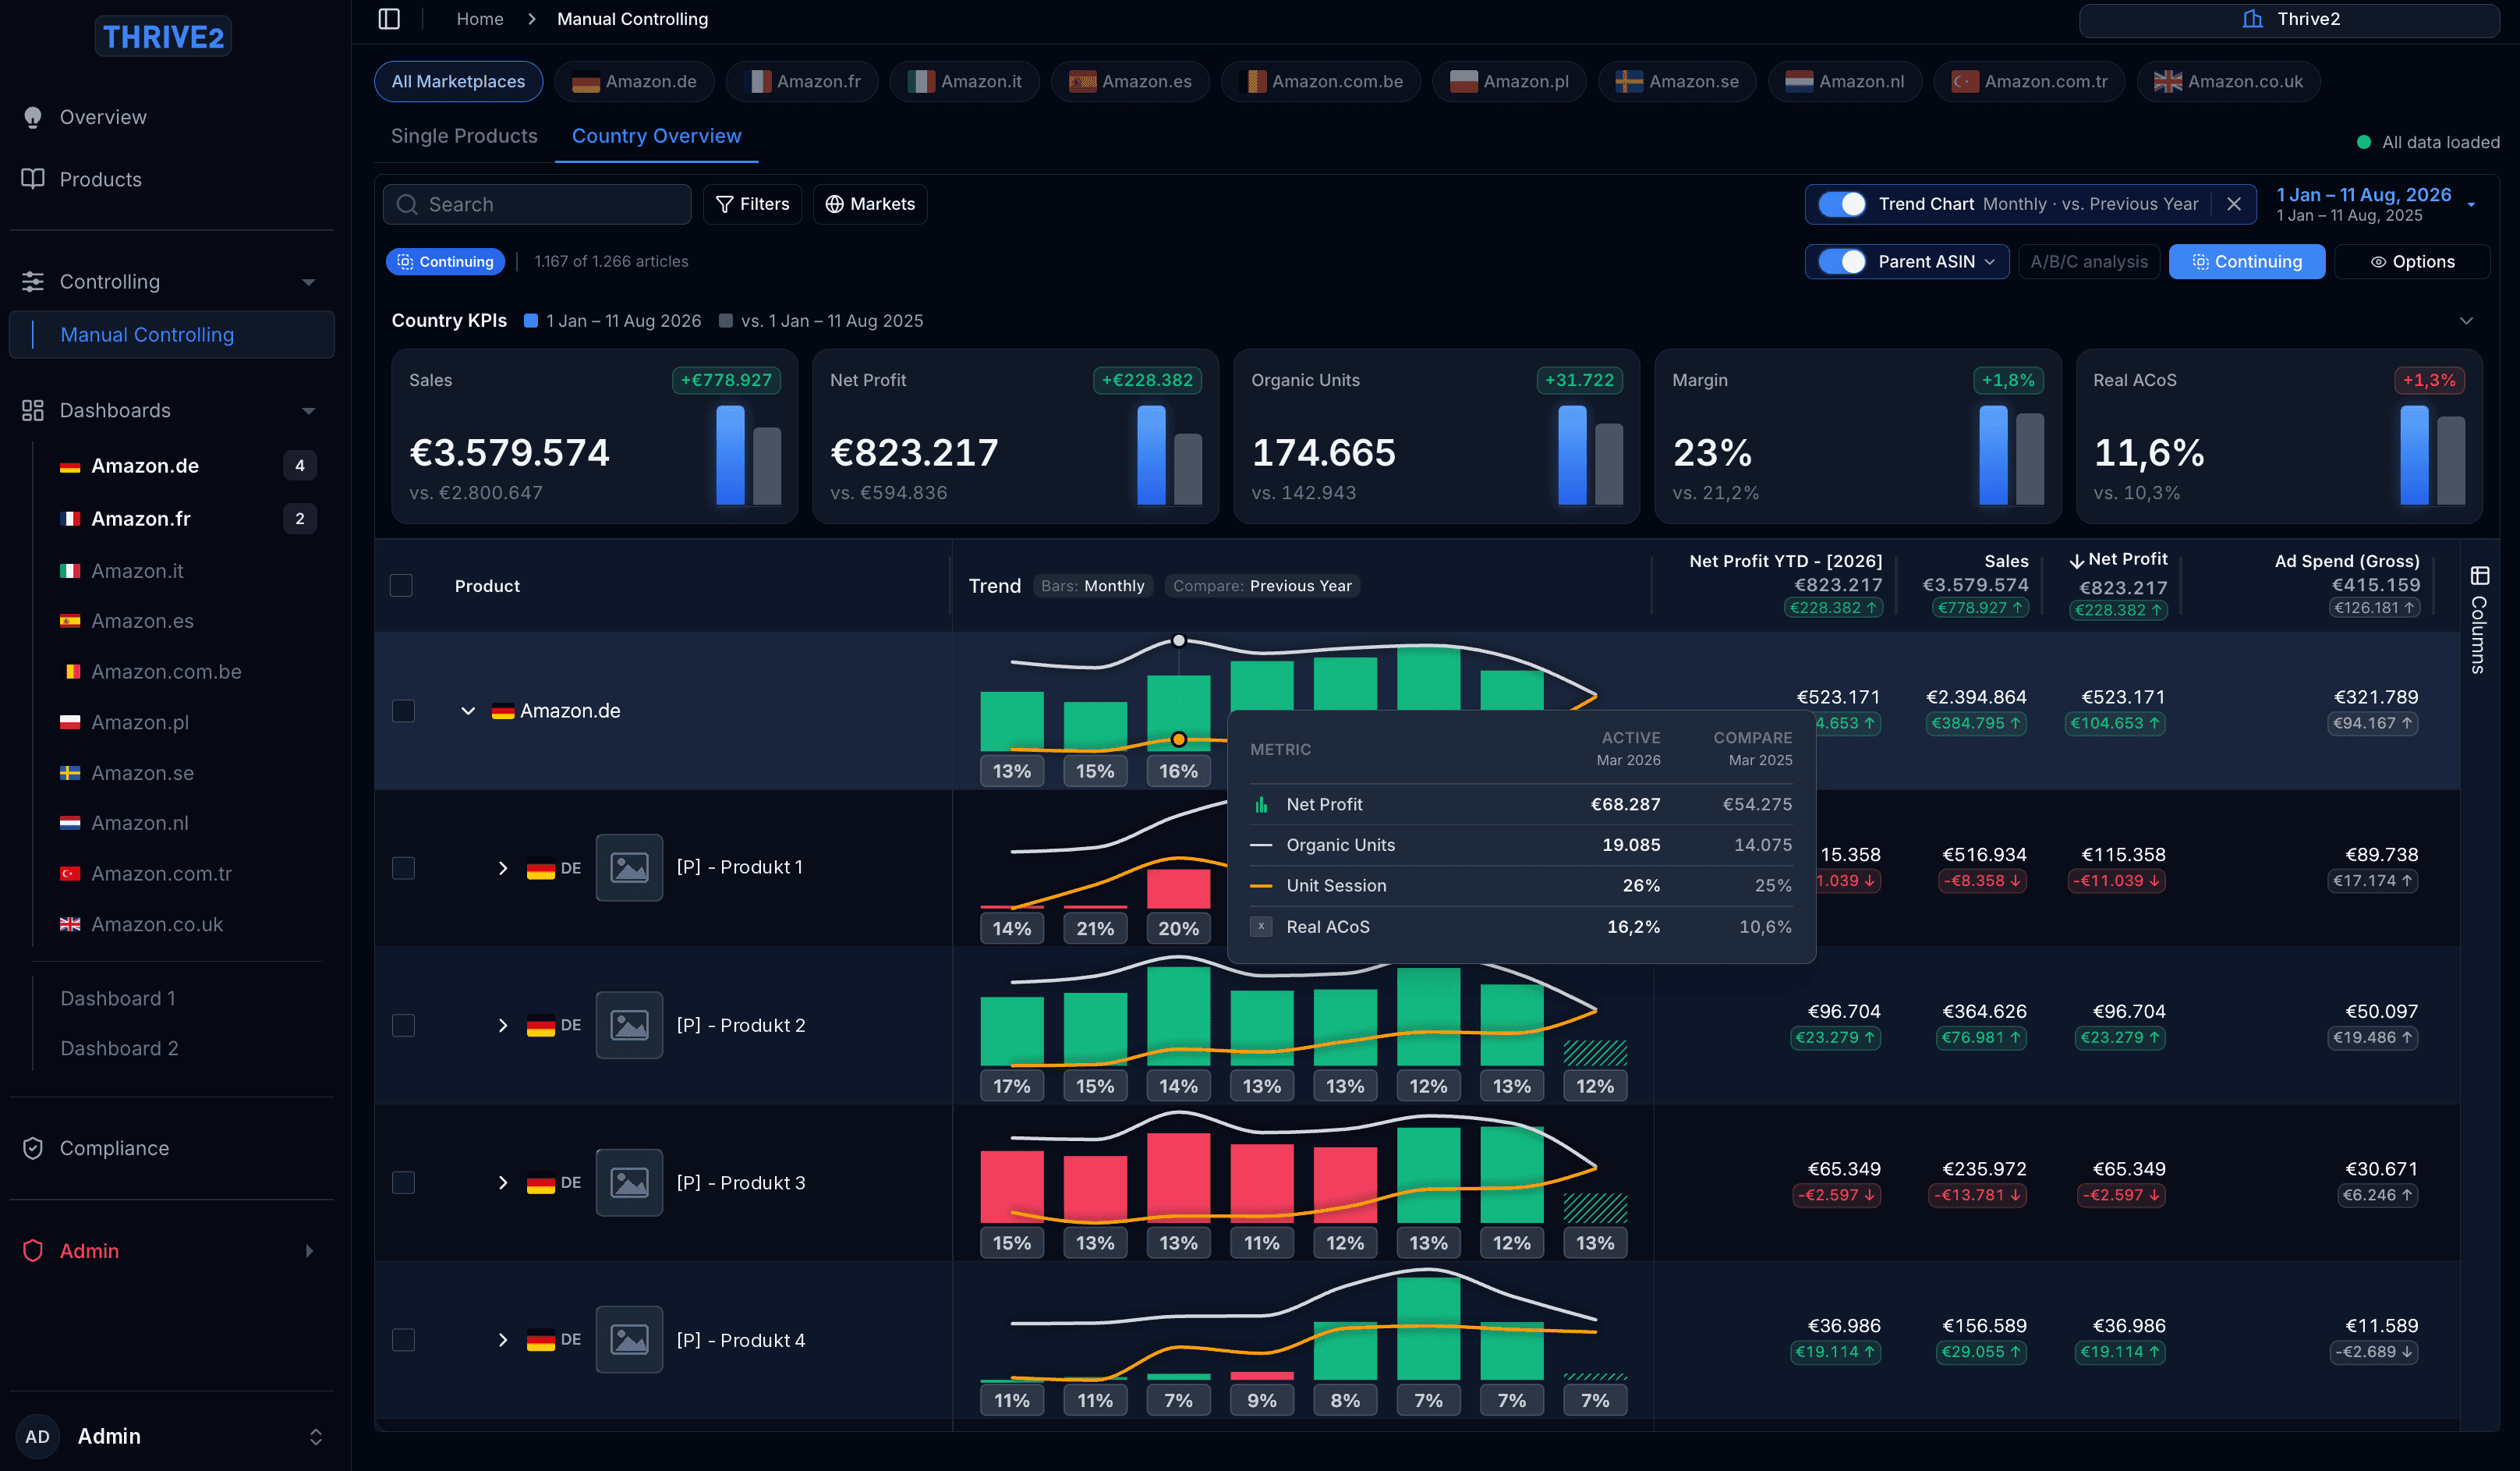
Inline charts per SKU with customizable KPI sets. Spot trends instantly in your table - colors show direction, hover reveals details - in every table.
04
Repeat
Problem gone? Move on. Still red? One more loop. Continuous improvement without hours lost - no reports nobody reads, just results.
In-view tracking engineInline charts in every rowRead the trend. Open nothing. Amazon.deMulti-KPI charts, no filteringZero manual trackingEverything in one view
 Amazon.frGroup by parent or categoryData computed at every grouping level
 Amazon.itCountry overview with KPI cardsP&L in BWA orderYear-over-year on every number.
 Amazon.esABC analysisFilter by any KPI or attributeBundles or single SKUs
 Amazon.nlSearch becomes a filterOne builds it, the team uses itNamed views. Saved and shared.
 Amazon.com.beOutliers surface first.5 minutes instead of 5 weeks
 Amazon.plCountry and manual dashboardsStages you define.Tasks that can't be ignored.No status without a note.
 Amazon.seNo orphan tasks.From problem to done in one place
 Amazon.com.trDeep dive protocolMeasure what a change didOptimization ROINothing gets lost, not even whyMillisecond loadsWarm before you clickPrecomputed, not recalculated.Switch countries, nothing loadsIt feels offlineEvery company in its own room.Multi-company & agency accountsRoles and teams, truly separatedOne-click tenant switchEdge-delivered. EU-resident.A data model an agent could read.PIM built inEPR compliance managementListings per countryThe import runs itselfA proven controlling process
Amazon.deMulti-KPI charts, no filteringZero manual trackingEverything in one viewAmazon.frGroup by parent or categoryData computed at every grouping levelAmazon.itCountry overview with KPI cardsP&L in BWA orderYear-over-year on every number.Amazon.esABC analysisFilter by any KPI or attributeBundles or single SKUsAmazon.nlSearch becomes a filterOne builds it, the team uses itNamed views. Saved and shared.Amazon.com.beOutliers surface first.5 minutes instead of 5 weeksAmazon.plCountry and manual dashboardsStages you define.Tasks that can't be ignored.No status without a note.Amazon.seNo orphan tasks.From problem to done in one placeAmazon.com.trDeep dive protocolMeasure what a change didOptimization ROINothing gets lost, not even whyMillisecond loadsWarm before you clickPrecomputed, not recalculated.Switch countries, nothing loadsIt feels offlineEvery company in its own room.Multi-company & agency accountsRoles and teams, truly separatedOne-click tenant switchEdge-delivered. EU-resident.A data model an agent could read.PIM built inEPR compliance managementListings per countryThe import runs itselfA proven controlling processSales€3.579.574▲ +€778.827Net sales€3.008.045▲ +€654.211Gross profit€1.204.882▲ +€196.410Net profit€823.217▲ +€218.382Net profit YTD€2.394.864▲ +€384.746Estimated payout€1.902.335▲ +€318.220Margin23,4%▲ +2,1%ROI104%▲ +12%Real ACoS8,4%▼ -1,9%Total CPO€4,12▼ -€0,38Optimization profit€112.480▲ +€41.905Optimization margin31,2%▲ +4,4%Optimization ROI148%▲ +23%Units174.665▲ +51.722Organic units106.512▲ +12.075Organic share71%▲ +6%Sessions1.284.930▲ +212.408Unit session %24,1%▲ +1,8%Return rate2,8%▼ -0,6%Sellable returns91%▲ +3%Refunds€65.349▼ -€12.480Ad spend€415.159→ +€37.174